Entries for June 2023
-

-
Had lots of fun shipping this feature ✌️
-
Cognitive Biases Ranked by Popularity
If you have spent some time on rationalist forums, you might have come across images that try to visualize cognitive biases that humans are prone to:
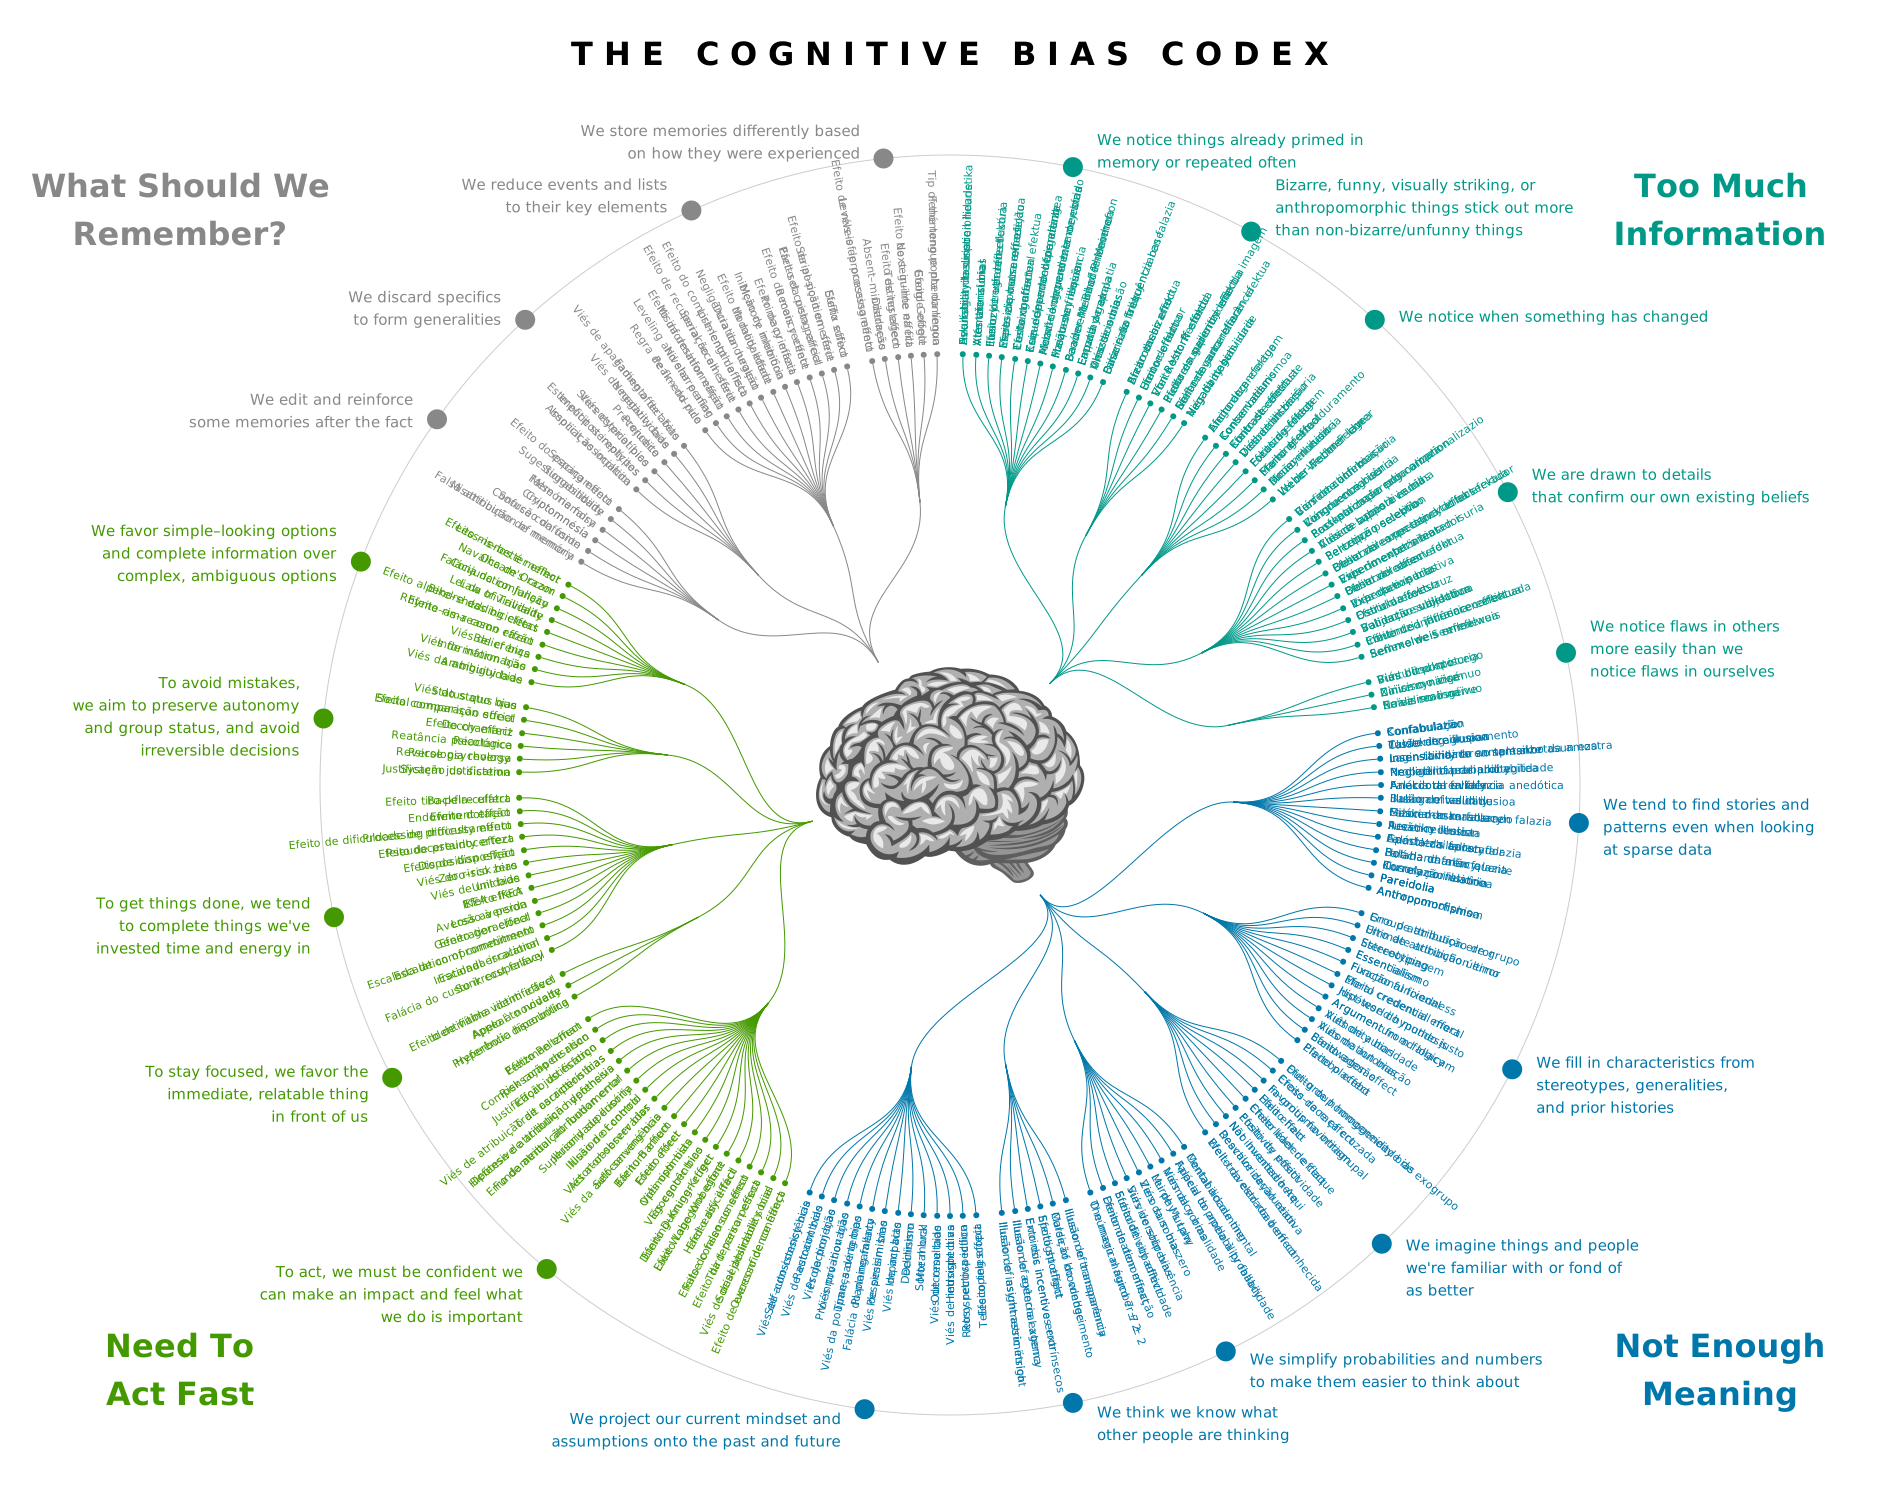
This specific one has been created by John Manoogian III and Buster Benson, who compiled the list of biases from Wikipedia.
It is a great way to get a sense of the sheer number of biases that exist, but it doesn’t tell you much about how much of the popular mindshare each bias has. All the biases having the same size implies that they are all equally important, but that is obviously not the case. Arguably, for someone who has just started to learn about cognitive biases, confirmation bias should be more important than, say, the Peltzmann effect.
To measure and visualize the popularity of each bias, I…
- ran a Google search with the format
"<insert cognitive bias here>" cognitive biasusing a SERP API, - got the number of search results for each term,
- created a wordcloud using the wordcloud Python package,
- used logarithms of the search count for better scaling,
- used the same colors as the Cognitive Bias Codex for consistency,
- used a shape mask of a brain to make it look cool.
Here is the result:
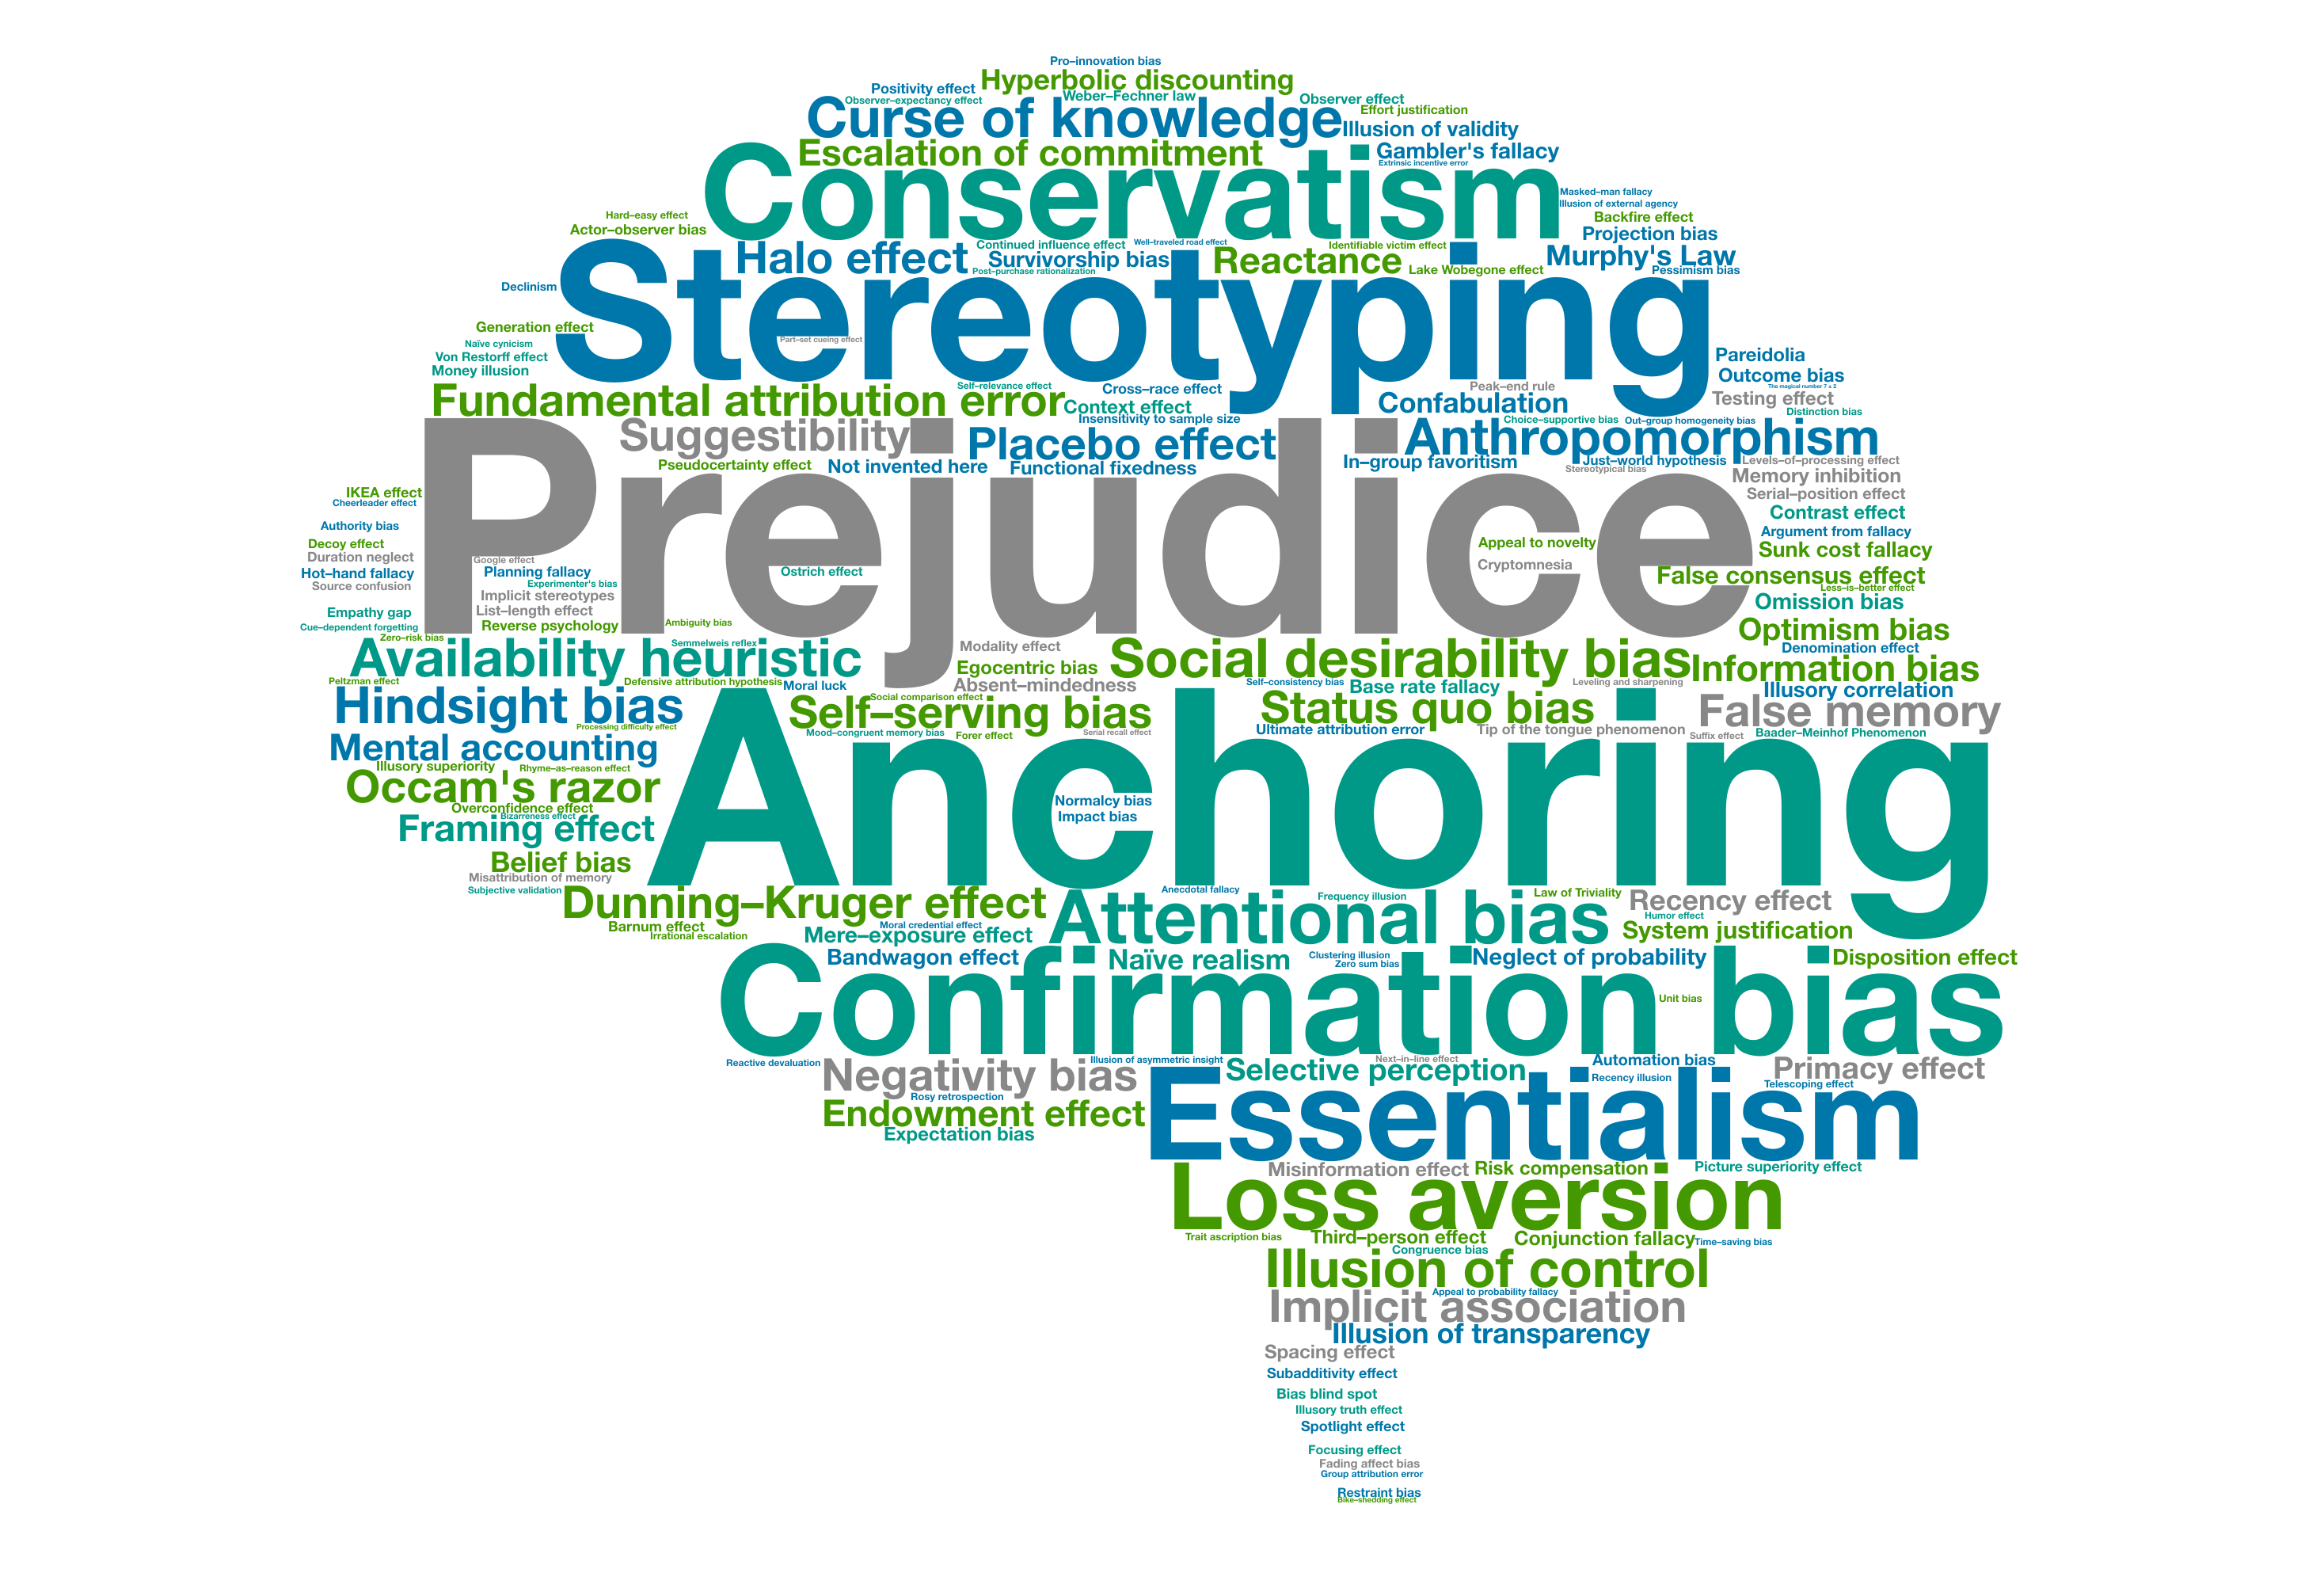
The bigger the font, the more Google search results there are for that bias, the assumption being Google search results are a good measure of popularity.
Why should you care about the popularity of biases? The more popular or common a bias is, the more likely you are to be affected by it. So it makes sense to study them in decreasing order of popularity, to maximize the benefit to your own thinking. However, this is all statistics—you could still be impacted more by a bias that is smaller in the wordcloud. For example, there was a time when I was very prone to the sunk cost fallacy, even though it doesn’t show up so large in the wordcloud.
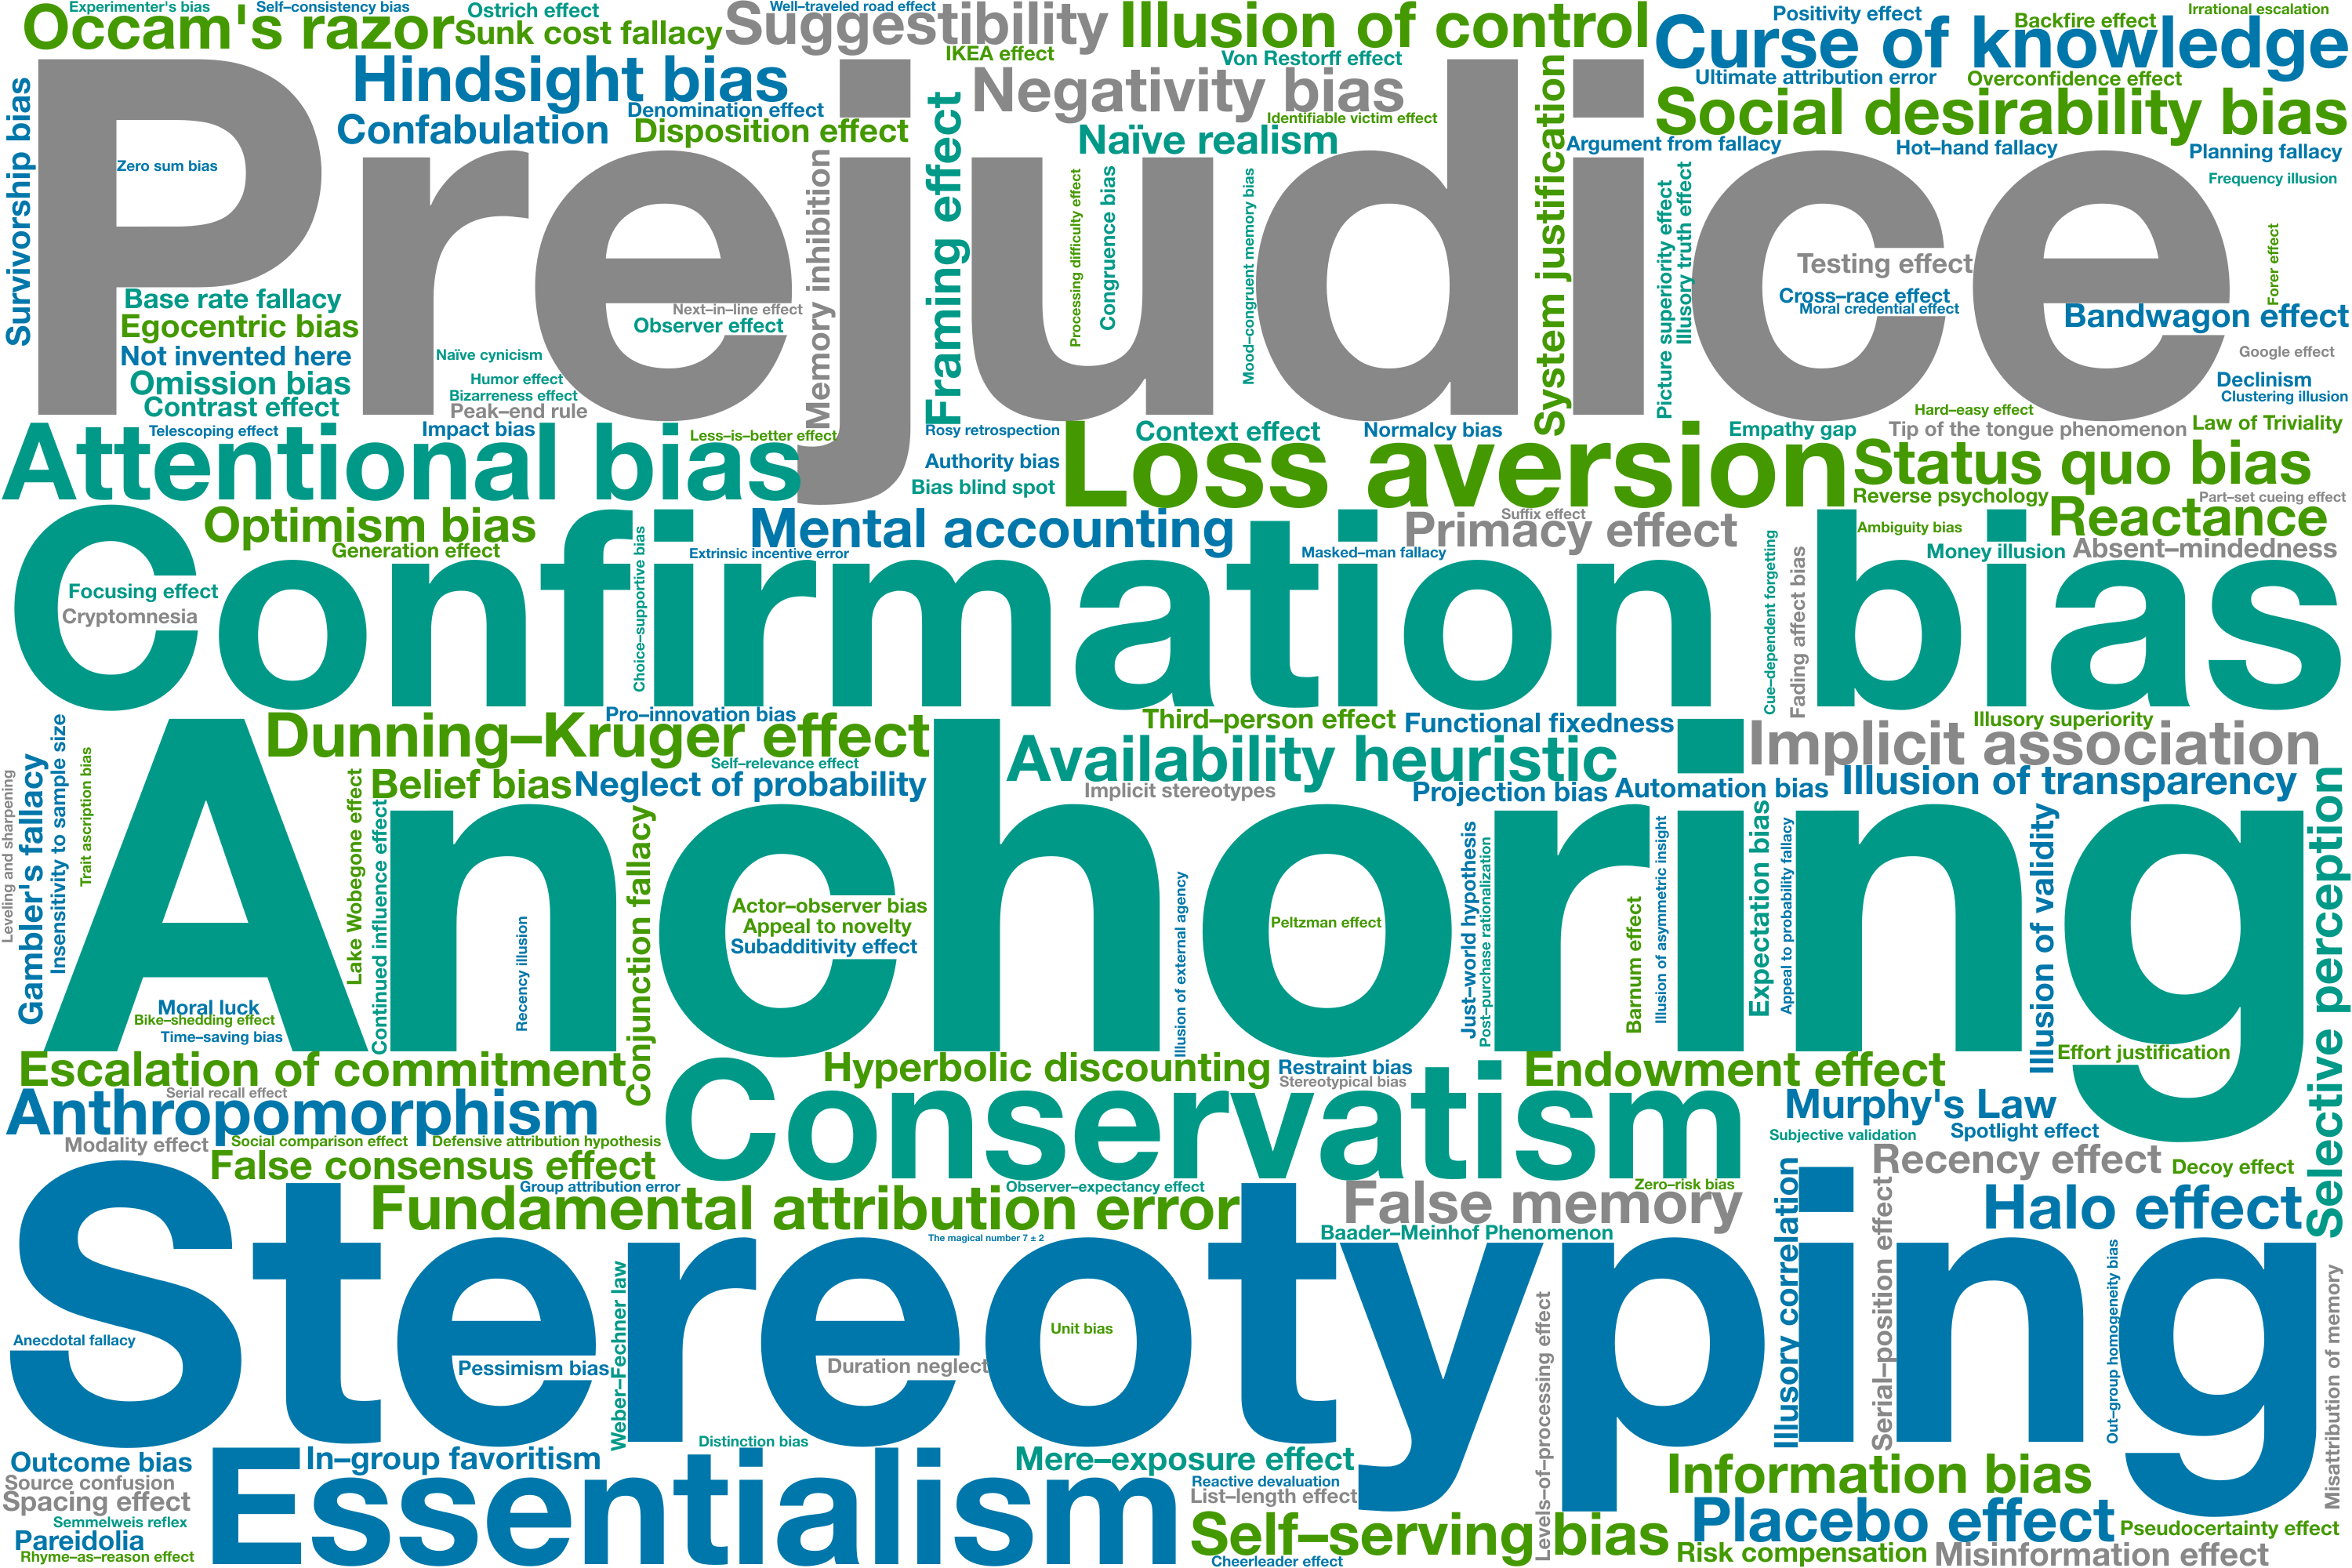
Below is a version of the image without the shape mask:
Below are the top 10 biases ranked by Google search result count:
Cognitive bias Search result count Prejudice 8,560,000 Anchoring 1,100,000 Stereotyping 1,080,000 Confirmation bias 992,000 Conservatism 610,000 Essentialism 436,000 Loss aversion 426,000 Attentional bias 374,000 Curse of knowledge 373,000 Social desirability bias 319,000 Click here to see the search result counts for each 188 biases included above.
I have also computed the average search result count for each category of biases, by dividing the total search result count for each category by the number of biases in that category:
Category Average count We discard specifics to form generalities 1,494,378 We notice when something has changed 237,141 We fill in characteristics from stereotypes, generalities, and prior histories 160,170 We are drawn to details that confirm our own existing beliefs 93,350 We think we know what other people are thinking 81,555 To act, we must be confident we can make an impact and feel what we do is important 72,435 We notice things already primed in memory or repeated often 70,835 To get things done, we tend to complete things we’ve invested time and energy in 65,822 To avoid mistakes, we aim to preserve autonomy and group status, and avoid irreversible decisions 65,750 We edit and reinforce some memories after the fact 59,503 We favor simple-looking options and complete information over complex, ambiguous options 52,491 We tend to find stories and patterns even when looking at sparse data 46,375 To stay focused, we favor the immediate, relatable thing in front of us 37,940 Bizarre, funny, visually striking, or anthropomorphic things stick out more than non-bizarre/unfunny things 37,081 We imagine things and people we’re familiar with or fond of as better 34,379 We simplify probabilities and numbers to make them easier to think about 33,881 We notice flaws in others more easily than we notice flaws in ourselves 31,390 We project our current mindset and assumptions onto the past and future 29,418 We reduce events and lists to their key elements 27,638 We store memories differently based on how they were experienced 20,440 Notice that the top few biases such as prejudice and anchoring highly skew the ranking.
Similarly, I have computed the average search result count for each top category of biases:
Top category Average count What Should We Remember? 316,297 Too Much Information 101,842 Need To Act Fast 64,568 Not Enough Meaning 64,134 You can see the code I used to create the figure here.
I will not try to reason as to why some biases are more popular than others, and instead leave that for another post.
- ran a Google search with the format