Blockchain Fee Volatility
Ethereum is a platform for distributed computing that uses a blockchain for data storage, thus inheriting the many benefits blockchain systems enjoy, such as decentralization and permissionlessness. It also inherited the idea of users paying nodes a fee to get their transactions included in the blockchain. After all, computation on the blockchain is not an infinite resource, and it should be allocated to users who actually find value in it. Otherwise, a feeless blockchain can easily be spammed and indefinitely suffer a denial-of-service attack.
Blockchain state advances on a block by block basis. On a smart contract platform, the quantity of computation as a resource is measured in terms of the following factors:
- Bandwidth: The number of bits per unit time that the network can achieve consensus on.
- Computing power: The average computing power of an individual node.
- Storage: The average storage capacity of an individual node.
The latter two are of secondary importance, because the bottleneck for the entire network is not the computing power or storage capacity of an individual node, but the overall speed of communicating the result of a computation to the entire network. In Bitcoin and Ethereum, that value is around 13 kbps1, calculated by dividing average full block size by average block time. Trying to increase that number, either by increasing the maximum block size or decreasing block time, indeed results in increased computational capacity. However it also increases the uncle rate2, thereby decreasing the quality of consensus—a blockchain’s main value proposition.
Moreover, users don’t just submit bits in their transactions. In Bitcoin, they submit inputs, outputs, amounts etc3. In Ethereum, they can just submit a sender and a receiver of an amount of ETH, or they can also submit data, which can be an arbitrary message, function call to a contract or code to create a contract. This data, which alters Ethereum’s world state, is permanently stored on the blockchain.
Ethereum is Turing complete, and users don’t know when and in which order miners will include their transactions. In other words, users have no way of predicting with 100% accuracy the total amount of computational resources their function call will consume, if that call depends on the state of other accounts or contracts4. Furthermore, even miners don’t know it up until the point they finish executing the function call. This makes it impractical for users to set a lump sum fee that they are willing to pay to have their transaction included, because a correlation between a transaction’s fee and its utilization of resources cannot be ensured.
To solve this problem, Ethereum introduced the concept of gas as a unit of account for the cost of resources utilized during transaction execution. Each instruction featured in the Ethereum Virtual Machine has a universally agreed cost in gas, proportional to the scarcity of the used resource5. Then instead of specifying a total fee, users submits a gas price in ETH and the maximum total gas they are willing to pay.
The costliest operations on Ethereum are those of non-volatile storage and access6, but these need not occupy space in a block. It’s the transactions themselves that are stored in the blocks and thus consume bandwidth. The gas corresponding to this consumption is called “intrinsic gas” (see the Yellow Paper), and it’s one of the reasons for the correlation between gas usage and block size:
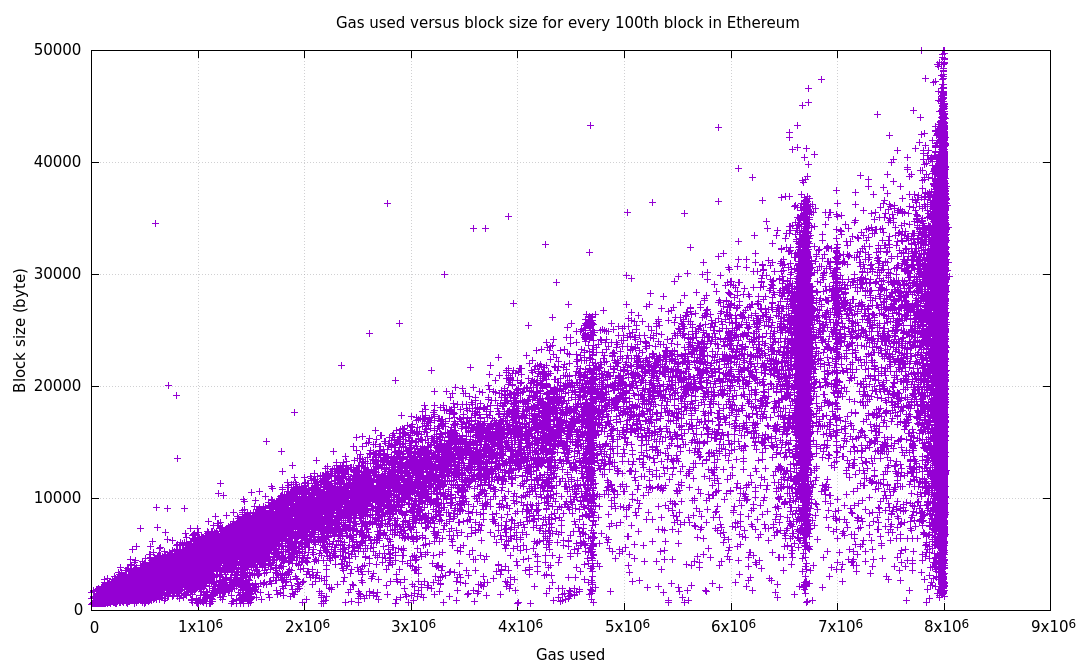
The vertical clusterings at 4.7m, 6.7m and 8m gas correspond to current and previous block gas limits. Gas costs of instructions should indeed be set in such a way that the correlation between a resource and overall gas usage should increase with the degree of bottleneck.
Gas Supply and Demand
The demand for transacting/computing on creates its own market, both similar and dissimilar to the markets of tangible products that we are used to. What is more important to us is the supply characteristics of this market. Supplied quantities aren’t derived from individual capacities and decisions of the miners, but from network bottlenecks. A limit is set on maximum gas allowed per block.
Supplied quantity is measured in terms of gas supplied per unit time, similar to bandwidth. Individual miners contribute hashrate to the network, but this doesn’t affect throughput. The difficulty adjustment mechanism ensures that network throughput remains the same, unless universally agreed parameters are changed by collective decision.
Moreover, the expenditure of mining a block far exceeds the expenditure of executing a block. In other words, changes in overall block fullness doesn’t affect miner operating expenses. Therefore, marginal cost is roughly zero, up until the point supply hits maximum throughput—where blocks become 100% full. At that point, marginal cost becomes infinite. This is characterized by a vertical supply curve located at maximum throughput, preceded by a horizontal supply curve.
This means that given a generic monotonically decreasing demand curve and a certain shift in demand, we can predict the change in the gas price, and vice versa. The price is located at the point where the demand curve intersects the supply curve. Major shifts in price starts to occur only when blocks become full. Past that point, users are basically bidding higher and higher prices to get their transactions included. See the figure below for an illustration.

This sort of econometric analysis can be done simply by looking at block statistics. Doing so reveals 2 types of trends in terms of period:
- Intraday volatility: Caused by shifts in demand that repeat periodically every day.
- Long term shifts: Caused by increases or decreases in the level of adoption, and not periodic.
Note: This view of the market ignores block rewards, but that is OK in terms of analyzing gas price volatility, because block rewards remain constant for very long periods of time. However, a complete analysis would need to take block rewards into account, because they constitute the majority of miner revenue.
Daily Demand Cycle and Intraday Volatility
Demand for gas isn’t distributed equally around the globe. Ethereum users exist in every inhabited continent, with the highest demand seen in East Asia, primarily China. Europe+Africa and the Americas seem to be hand in hand in terms of demand. This results in predictable patterns that follow the peaks and troughs of human activity in each continent. The correlation between gas usage and price is immediately noticeable, demonstrated by a 5 day period from March 2019.

The grid marks the beginnings of the days in UTC, and the points in the graph correspond to hourly averages, calculated as:
- Average hourly gas usage per block = Total gas used in an hour / Number of blocks in an hour
- Average hourly gas price = Total fees collected in an hour / Total gas used in an hour
Averaging hourly gives us a useful benchmark to compare, because block-to-block variation in these attributes is too much for an econometric analysis.
One can see above that the average gas price can change up to 2 to 4 times in a day. This shows us that Ethereum has found real use around the world, but also that there exists a huge UX problem in terms of gas prices.
Dividing the maximum gas price in a day by the minimum, we obtain a factor of intraday volatility:

Ethereum has witnessed gas price increases of up to 100x in a day. Smoothing out the data, we can see that the gas price can change up to 4x daily on average.
To understand the effect of geographic distribution on demand, we can process the data above to obtain a daily profile for gas usage and price. We achieve this by dividing up the yearly data set into daily slices, and standardizing each slice in itself. Then the slices are superimposed and their mean is calculated. The mean curve, though not numerically accurate, makes sense in terms of ordinal difference between the hours of an average day.

One can clearly see that gas usage and price are directly correlated. At 00:00 UTC, it’s been one hour since midnight in Central Europe, but that’s no reason for a dip in demand—China just woke up. The first dip is seen at 03:00 when the US is about to go to sleep, but then Europe wakes up. The demand dips again after 09:00, but only briefly—the US just woke up. We then encounter the biggest dip from 15:00 to 23:00 as China goes to sleep.
Surely there must be a way to absorb this volatility! Solving this problem would greatly improve Ethereum’s UX and facilitate even greater mainstream adoption.
Long Term Shifts in Demand
The long term—i.e. $\gg$ 1 day—shifts in demand are unpredictable and non-periodic. They are caused by adoption or hype for certain applications or use cases on Ethereum, like
- ICOs,
- decentralized exchanges,
- DAI and CDPs,
- interest bearing Dapps,
- games such as Cryptokitties and FOMO3D,
- and so on.
These shifts in price generally mirror ETH’s own price. In fact, it’s not very objective to plot a long term gas price graph in terms of usual Gwei, because most people submit transactions considering ETH’s price in fiat. For that reason, we denote gas price in terms of USD per one million gas, and plot it on a logarithmic scale:

The price of gas has seen an increase of many orders of magnitude since the launch of the mainnet. The highest peak corresponds to the beginning of 2018 when the ICO bubble burst, similar to the price of ETH. Although highly critical for users and traders, this sort of price action is not very useful from a modeling perspective.
Conclusion
The volatility in gas price stems from the lack of scalability. In 2019 on Ethereum, daily gas price difference stayed over 2x on average. The cycle’s effect is high enough to consider it as a recurring phenomenon that requires its own solution.
I think the narrative that gas price volatility is caused only by the occasional game/scam hype is incomplete—in a blockchain that has gained mainstream adoption such as Ethereum, the daily cycle of demand by itself is enough to cause volatility that harms the UX for everyone around the globe.
While increasing scalability is the ultimate solution, users may still benefit from mechanisms that allow them to hedge themselves against price increases, like reserving gas on a range of block heights. This would make a good topic for a future post.
-
As of October 2019. ↩
-
The rate at which orphaned blocks show up. ↩
-
But in practice, they can estimate it reliably most of the time. ↩
-
See Appendix G (Fee Schedule) and H (Virtual Machine Specification) of the Ethereum Yellow Paper. ↩
-
https://medium.com/coinmonks/storing-on-ethereum-analyzing-the-costs-922d41d6b316 ↩